What the September inflation figures say
The ONS consumer price inflation bulletin for September 2026, published on 21 October, shows CPI inflation at 3.5%, up from 3.1% in August and the highest rate since October 2025. CPIH, the wider measure that includes housing costs, rose to 3.6%.
The ONS names transport, "particularly motor fuels", as the largest upward contribution to the change. The key numbers:
- Petrol averaged 169.5p a litre in September, up 8.2p in a month and the highest since August 2022. In September 2025 it fell by 0.2p.
- Diesel averaged 192.5p a litre, up 10.7p in a month and the highest since July 2022.
- Motor fuel prices overall were 29.8% higher than a year earlier, up from 23.0% in August.
- Transport inflation jumped from 4.6% to 6.6%, and transport added 0.94 percentage points to the 3.5% CPI rate, more than any other category.
In short, nearly a percentage point of the UK's headline inflation rate is now down to getting around, and fuel is the biggest part of that.
The ONS fuel series DOGQ: what it measures
The ONS series DOGQ is often quoted alongside fuel stories, so it helps to be precise about it. Its full title is "RPI: Percentage change over 12 months - Petrol and Oil incl Fuel Oil". It is a part of the Retail Prices Index (RPI), not CPI, and it shows how much petrol and oil prices have changed compared with the same month a year earlier. The latest figures were released on 21 October 2026, with the next update due on 18 November 2026.
| Month | DOGQ: annual change in RPI petrol and oil |
|---|---|
| September 2025 | -1.4% |
| December 2025 | 1.3% |
| February 2026 | -4.5% |
| March 2026 | 10.4% |
| April 2026 | 29.6% |
| May 2026 | 28.0% |
| June 2026 | 23.6% |
| July 2026 | 15.6% |
| August 2026 | 25.3% |
| September 2026 | 32.9% |
Source: ONS series DOGQ, dataset MM23, released 21 October 2026.
The pattern matches the pump prices. Fuel was cheaper than a year earlier through most of 2025 and into February 2026. Then the annual rate swung from -4.5% in February to 29.6% in April, eased over the summer as prices dipped, and climbed again to 32.9% in September. The DOGQ figure is a little higher than the CPI motor fuels figure of 29.8% because RPI is built differently and this series also covers oil products. The ONS itself notes that RPI is no longer an accredited official statistic, so CPI is the better guide to headline inflation, while DOGQ is a useful check on the direction of travel.
Pump prices since September: still near the top
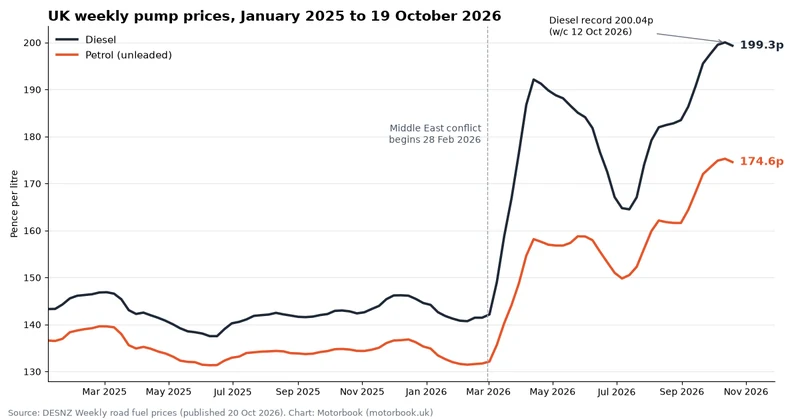
The weekly road fuel prices from the Department for Energy Security and Net Zero (DESNZ) run ahead of the monthly ONS numbers. The latest update, published on 20 October 2026, covers the week starting Monday 19 October.
| DESNZ weekly average | Petrol (unleaded) | Diesel |
|---|---|---|
| Week of 19 Oct 2026 (latest) | 174.57p | 199.33p |
| Week of 12 Oct 2026 (peak) | 175.28p | 200.04p |
| Week of 21 Sep 2026 (a month ago) | 172.01p | 195.53p |
| Week of 23 Feb 2026 (before the spring rise) | 131.71p | 141.46p |
| Week of 20 Oct 2025 (a year ago) | 134.69p | 142.81p |
| Change over a year | +39.88p (+29.6%) | +56.52p (+39.6%) |
Source: DESNZ weekly road fuel prices, 2018 to date (CSV), published 20 October 2026.
A few things stand out:
- Diesel set a record. 200.04p in the week of 12 October is the highest weekly diesel average in the DESNZ series, which goes back to June 2003. The previous high was 199.22p in the week of 4 July 2022. The RAC's daily figures tell the same story, with diesel passing its old record to reach 200.01p on 2 October, beating the 199.18p high we covered when UK diesel hit an all-time high in late September. Petrol, at 175.28p, is still well below its July 2022 record of 191.55p.
- The last week brought a tiny dip. Both fuels fell by about 0.7p between 12 and 19 October, the first weekly fall for petrol since late August and for diesel since mid July.
- The diesel premium has tripled. Diesel cost 8.1p a litre more than petrol a year ago. It now costs 24.8p more.
- A 50 litre tank of petrol costs about £87 at the latest weekly average, around £20 more than a year ago. The same tank of diesel costs about £100, around £28 more.
Tax hasn't changed, the fuel has
Every litre carries fuel duty and VAT. According to the DESNZ data, fuel duty stayed at 52.95p a litre for petrol and diesel throughout 2025 and 2026, and VAT stayed at 20%. Working those out of the latest weekly prices gives this picture:
| Per litre | Petrol, Oct 2025 | Petrol, Oct 2026 | Diesel, Oct 2025 | Diesel, Oct 2026 |
|---|---|---|---|---|
| Pump price | 134.69p | 174.57p | 142.81p | 199.33p |
| Fuel duty | 52.95p | 52.95p | 52.95p | 52.95p |
| VAT (20%) | 22.45p | 29.10p | 23.80p | 33.22p |
| Everything else (fuel, delivery, retailer margin) | 59.29p | 92.52p | 66.06p | 113.16p |
Motorbook calculation from DESNZ weekly figures for the weeks of 20 October 2025 and 19 October 2026.
The part of the price that is not tax rose by about 33p a litre for petrol and 47p for diesel. VAT added a bit more on top, because it is charged as a percentage of a higher price. Tax now makes up about 47% of a litre of petrol and 43% of a litre of diesel, a smaller share than a year ago, even though drivers are paying more tax per litre in cash terms.
The steep climb began in March 2026. The ONS bulletin refers to the outbreak of conflict in the Middle East on 28 February 2026, and weekly pump prices rose almost every week from then until mid April. The cost of crude oil explains most of it: the DESNZ Quarterly Energy Prices report for September 2026 says crude oil prices in August 2026 were 23.5% higher than in February and 23.1% higher than a year earlier, and that since March they "have been further impacted by the Middle East conflict". In September, BBC News reported Brent crude back at $100 a barrel, against around $70 before the conflict began.
What drivers are paying today: live forecourt data
Motorbook's live UK fuel prices page works out a national average from the government's Fuel Finder data, where forecourts have to report price changes within 30 minutes. At 13:12 BST on 21 October 2026 it showed:
- Unleaded (E10): 174.0p a litre, from 7,305 current station prices, down 0.3p on a week ago.
- Diesel: 199.1p a litre, from 7,502 current station prices, also down 0.3p on a week ago.
- Super unleaded: 191.4p and premium diesel: 218.5p.
- 7,796 forecourts reporting in total.
Those live averages sit very close to the DESNZ weekly figures for 19 October (174.57p and 199.33p), which is a good sign that both sources are picking up the same trend.
The spread is bigger than the national average suggests
Averages hide a wide range. Across the UK on 21 October, current unleaded prices ran from 157.9p to 209.9p and diesel from 169.9p to 234.9p. The very top of that range is mostly motorway services and remote sites, but there are big gaps inside cities too.
| City (radius from centre) | Petrol average | Cheapest petrol | Diesel average | Cheapest diesel | Stations |
|---|---|---|---|---|---|
| London (20 km) | 174.4p | 164.9p | 200.3p | 189.7p | 431 |
| Birmingham (10 km) | 174.7p | 162.9p | 199.5p | 174.9p | 117 |
| Manchester (10 km) | 173.8p | 163.9p | 198.8p | 187.9p | 116 |
| Glasgow (10 km) | 173.8p | 166.9p | 199.6p | 190.9p | 80 |
Source: Motorbook analysis of UK Government Fuel Finder data, updated 21 October 2026, 13:12 BST.
On a 50 litre fill, choosing the cheapest petrol station rather than paying the city average would save about £4.75 in London, £5.90 in Birmingham, £4.95 in Manchester and £3.45 in Glasgow. Diesel drivers in Manchester could save about £5.45 and in London about £5.30. Glasgow had the narrowest range of the four cities, with petrol prices only 12p apart from top to bottom, compared with 35p to 39p in London, Birmingham and Manchester.
Supermarkets remain a little cheaper on average. Sainsbury's averaged 171.6p for unleaded and 196.4p for diesel, Morrisons 171.7p and 196.9p, and Tesco 172.1p and 196.7p, roughly 2p to 3p a litre under the national average. Several of the cheapest city prices were at Costco, which needs a membership.
Why price freshness matters
Each price on the city pages has a "last updated" time, and some of the cheapest ones had not changed for a while. Birmingham's cheapest diesel, at 174.9p, was last updated on 15 October, almost 25p below the city average. Glasgow's cheapest diesel was last updated on 1 October and one of Manchester's cheapest petrol prices on 28 September. An older timestamp can simply mean the price hasn't changed, but in a month when prices moved by several pence, it is worth checking before driving across town for it.
Why the official averages and live prices differ
Three sets of figures are doing the rounds this week, and they don't quite match. That is normal.
- ONS monthly prices (169.5p petrol, 192.5p diesel) are averages for the whole of September. Prices climbed through the month, so the September average is lower than where prices ended up. The ONS figures line up with the average of the four DESNZ weekly readings in September (169.50p and 192.55p).
- DESNZ weekly prices (174.57p, 199.33p) are a single reading for each week, usually published on the Tuesday for prices collected that Monday. According to the DESNZ data sources and methodology note, the figures come from a Monday morning survey of four oil companies and two supermarkets, covering around 65% of the market when the note was last updated, averaged with weights based on each company's annual sales. That makes them the best guide to the trend over time.
- Live forecourt averages (174.0p, 199.1p) on the Motorbook fuel page come from one current price per reporting forecourt in the Fuel Finder feed, averaged without weighting by sales. Closed sites, implausible prices and stale prices are excluded. They change through the day.
So a headline saying "petrol averaged 169.5p" and a forecourt showing 175p can both be right. They are measuring different time periods in different ways.
How to pay less for fuel right now
- Compare forecourts near you before you fill up. Check the UK fuel prices page or your city page (London, Birmingham, Manchester, Glasgow). A 10p gap on 50 litres is £5.
- Check when the price was last updated. A cheap price that hasn't changed for a fortnight might not be there when you arrive.
- Don't drive too far for a saving. A detour of a few miles can use up a saving of a couple of pence a litre, especially in a less efficient car.
- Try supermarket forecourts first. Sainsbury's, Morrisons and Tesco were 2p to 3p a litre under the national average on 21 October.
- Avoid motorway services where possible. The most expensive prices in the national data are mostly there.
- Keep tyres at the right pressure and lose the roof box. Both cut fuel use on every journey.
- Track what you spend. Knowing what each fill-up costs makes it easier to spot when prices or your driving habits change.
The Motorbook app for iPhone shows nearby fuel prices from the same Fuel Finder data, with the time each price was last updated, and keeps MOT, tax and insurance reminders, service history and running costs in one place.
Frequently asked questions
Why are fuel prices going up?
Fuel duty (52.95p a litre) and VAT (20%) have not changed, so the rise is in the cost of the fuel itself, plus delivery and retailer margins. That part of the price is about 33p a litre higher for petrol and 47p higher for diesel than a year ago. The main driver is crude oil, which DESNZ says was 23.5% dearer in August 2026 than in February, after the conflict in the Middle East began on 28 February.
How much was petrol in the UK in October 2026?
On 21 October 2026, at 13:12 BST, the UK average for unleaded petrol (E10) was 174.0p a litre and diesel was 199.1p, based on more than 7,000 forecourts in the government's Fuel Finder data. The latest live figure is on the Motorbook UK fuel prices page.
Does fuel affect inflation?
Yes, quite a lot. Motor fuels made the biggest upward contribution to the rise in CPI inflation from 3.1% to 3.5% in September 2026, and transport as a whole added 0.94 percentage points to the headline rate. Higher fuel prices also feed through to delivery costs and other prices over time.
Is diesel more expensive than petrol?
Yes, and the gap has grown. In the week of 19 October 2026, diesel averaged 199.33p and petrol 174.57p, a difference of 24.8p a litre. A year earlier the gap was 8.1p.
Has diesel ever been this expensive in the UK?
Not in the weekly government figures. Diesel averaged 200.04p a litre in the week of 12 October 2026, the highest in the DESNZ series that starts in 2003. The previous high was 199.22p in July 2022.
Why is the ONS petrol price lower than pump prices today?
The ONS figure of 169.5p is the average for the whole of September. Prices rose through the month, so they finished higher than the average. Live forecourt prices in late October are around 174p.
What is ONS series DOGQ?
DOGQ is the 12-month percentage change in the Retail Prices Index for petrol and oil, including fuel oil. It was 32.9% in September 2026, up from 25.3% in August.
Will fuel prices come down?
Both fuels dipped by about 0.7p in the latest weekly figures and live averages were 0.3p lower than a week earlier on 21 October, but prices remain close to their highs. DESNZ usually publishes new weekly figures on a Tuesday, so the next update is expected on 27 October, and the next ONS inflation figures are due on 18 November 2026.
Sources
- Office for National Statistics, Consumer price inflation, UK: September 2026 (21 October 2026)
- Office for National Statistics, RPI: Percentage change over 12 months - Petrol and Oil incl Fuel Oil (DOGQ) (released 21 October 2026)
- Department for Energy Security and Net Zero, Weekly road fuel prices (last updated 20 October 2026), including the 2018 to date CSV and 2003 to 2017 CSV
- Department for Energy Security and Net Zero, Road fuel price statistics: data sources and methodologies
- Department for Energy Security and Net Zero, Quarterly Energy Prices: September 2026 (PDF) (29 September 2026)
- RAC, UK diesel price hits new record high of £2 a litre (2 October 2026)
- BBC News, Petrol prices rise by 5p over a week as Iran war sends oil higher (9 September 2026)
- Motorbook, UK petrol and diesel prices today and downloadable data, Motorbook analysis of UK Government Fuel Finder data, 21 October 2026, 13:12 BST
Image credits
- Fuel pump nozzle: photo by Michael Pointner on Unsplash, used under the Unsplash License.
- Fuel gauge: photo by Srattha Nualsate on Pexels, used under the Pexels License.
- Price chart: Motorbook, using DESNZ data under the Open Government Licence v3.0.
Motorbook is independent and is not affiliated with GOV.UK, DESNZ, ONS, DVLA or DVSA. Contains Fuel Finder data from GOV.UK, available under the Open Government Licence v3.0. This article is for general information.